Plot ini
the plot config is used to plot the results from the log folder. The plot config is used for the MainPlot.py in the example folder
Log
defines the log-folder and the location, where the plot’s should be saved
Main Structure
Key |
Value |
|---|---|
path_dir |
bool: True or False, defines if all events should be saved |
save_dir |
relative path, where the log files should be changed |
file_type |
list of the selected output formats, possible types: eps, pdf, pgf, png, ps, raw, rgba, svg, svgz |
Example
[Log]
path_dir="/example/log/11292020_07-19-15_5_3"
save_dir="/example/log/11292020_07-19-15_5_3/plot"
#supported: formats eps, pdf, pgf, png, ps, raw, rgba, svg, svgz
file_type=['png','svg','pdf']
Style
defines the plot style
Main Structure
Key |
Value |
|---|---|
colormap |
defines the colors |
marker |
defines the marker style, the first marker is the standard marker |
For further colormaps view: Classes of colormaps For marker style view: matplotlib.markers
Example
[Style]
colormap="Accent"
marker=['','o','r']
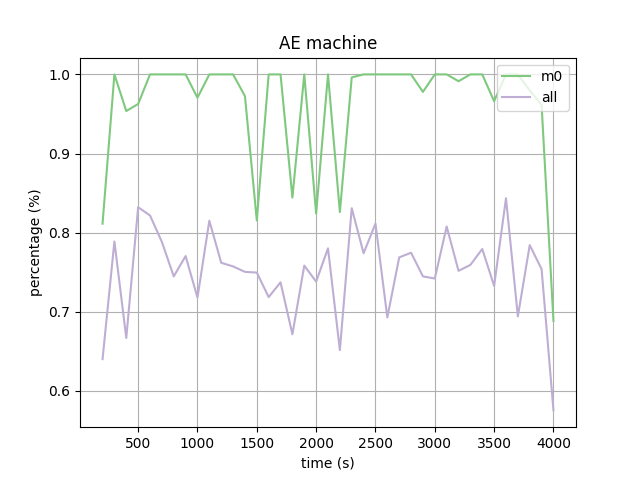
LinePlot
plot’s one kpi as line plot
Main Structure
Key |
Value |
|---|---|
y_data |
list of dict with {‘kpi’:name of kpi,’type’,’object_name’: (optional) [list of labels]} |
the following types are defined: machine, transporter, queue, product, transporter_distribution, simulation
object_name: optional parameter, if not defined all labels + ‘all’ are used, if object_name is defined only the labels in the list are shown, therefore object_name is used as filter
Example
[LinePlot]
#without object name all data are shown
y_data=[{'kpi':'AE','type':'machine','object_name':['m0','all']},{'kpi':'FillLevel','type':'queue'}]
MultipleLinePlot
plot’s multiple kpi as line plot, each kpi has it’s own subchart
Main Structure
Key |
Value |
|---|---|
y_data |
list of dict with {‘title’:str,’data’:[{‘kpi’,’type’,’object_name’ (optional)}]} the data dict is identical to line plot |
the following types are defined: machine, transporter, queue, product, transporter_distribution, simulation
object_name: optional parameter, if not defined all labels + ‘all’ are used, if object_name is defined only the labels in the list are shown, therefore object_name is used as filter
Example
[MultipleLinePlot]
#max 3 kpis
settings=[{'title':"compare some parameters",'data':[{'kpi':'AE','type':'machine','object_name':['m0','all']},{'kpi':'FE','type':'transporter'}]}]

ScatterPlot
compares two kpi as a scatter plot with histogram at both axes
Main Structure
Key |
Value |
|---|---|
x_data |
list of dict with {‘kpi’,’type’,’object_name’ (optional)} the dict is identical to line plot |
y_data |
list of dict with {‘kpi’,’type’,’object_name’ (optional)} the dict is identical to line plot |
the following types are defined: machine, transporter, queue, product, transporter_distribution, simulation
object_name: optional parameter, if not defined all labels + ‘all’ are used, if object_name is defined only the labels in the list are shown, therefore object_name is used as filter
the first x_data is correlated with the first y_data and so on
Example
[ScatterPlot]
x_data=[{'kpi':'AE','type':'machine','object_name':'m1'},{'kpi':'A','type':'machine','object_name':'m1'}]
y_data=[{'kpi':'AE','type':'machine','object_name':'m0'},{'kpi':'A','type':'machine','object_name':'m0'}]

Complete file
this file is available in example/config/plot_log.ini
[Log]
path_dir="/example/log/11292020_07-19-15_5_3"
save_dir="/example/log/11292020_07-19-15_5_3/plot"
#supported: formats eps, pdf, pgf, png, ps, raw, rgba, svg, svgz
file_type=['png','svg','pdf']

[Style]
colormap="Accent"
marker=['','o','r']

[LinePlot]
#without object name all
y_data=[{'kpi':'AE','type':'machine','object_name':['m0','all']},{'kpi':'FillLevel','type':'queue'}]

[MultipleLinePlot]
#max 3 kpis
settings=[{'title':"compare some parameters",'data':[{'kpi':'AE','type':'machine','object_name':['m0','all']},{'kpi':'FE','type':'transporter'}]}]


[ScatterPlot]
x_data=[{'kpi':'AE','type':'machine','object_name':'m1'},{'kpi':'A','type':'machine','object_name':'m1'}]
y_data=[{'kpi